
| Month |
January
|
February
|
March
|
April
|
May
|
June
|
|---|---|---|---|---|---|---|
| 2020 | 9,073 | 11,908 | 13,502 | 11,896 | 10,232 | 9,836 |
| 2019 | 12,487 | 8,783 | 12,312 | 11,871 | 12,041 | 10,997 |
| 2018 | 14,937 | 11,244 | 14,863 | 13,683 | 15,053 | 14,171 |
| 2017 | 15,570 | 16,319 | 19,674 | 18,936 | 17,333 | 17,851 |
| 2016 | 17,216 | 14,650 | 19,841 | 18,770 | 19,463 | 19,872 |
| 2015 | 20,212 | 15,806 | 24,132 | 21,289 | 20,425 | 22,178 |
| 2014 | 18,402 | 17,998 | 21,338 | 22,112 | 21,091 | 21,185 |
| 2013 | 18,102 | 15,000 | 19,166 | 18,612 | 19,979 | 17,586 |
| 2012 |
11,724
|
14,573
|
16,400
|
13,717
|
17,400
|
16,037
|
| 2011 |
13,143
|
11,494
|
14,237
|
13,671
|
14,679
|
16,309
|
| 2010 | 16,433 | 14,181 | 17,750 | 15,494 | 15,449 | 15,526 |
| 2009 | 19,298 | 21,322 | 23,869 | 22,302 | 21,727 | 22,952 |
| 2008 | 27,391 | 24,267 | 27,358 | 27,200 | 26,885 | 26,241 |
| 2007 | 40,253 | 33,255 | 38,796 | 35,580 | 36,511 | 33,975 |
| 2006 | 64,125 | 61,871 | 61,736 | 55,315 | 55,819 | 51,944 |
| 2005 | 112,842 | 93,463 | 106,100 | 97,646 | 93,060 | 89,915 |
| 2004 | 196,745 | 192,377 | 198,000 | 179,143 | 171,235 | 157,750 |
| 2003 | 332,405 | 294,680 | 343,984 | 423,847 | 356,415 | 305,687 |
| 2002 | 624,238 | 477,016 | 555,088 | 525,303 | 491,417 | 428,642 |
| 2001 | 1,020,204 | 992,747 | 1,109,567 | 1,052,051 | 1,038,174 | 971,711 |
| 2000 | 1,156,901 | 1,099,303 | 1,274,990 | 1,298,920 | 1,324,493 | 1,284,643 |
| 1999 | 679,593 | 646,899 | 790,610 | 774,437 | 858,176 | 863,785 |
| 1998 | 292,119 | 294,258 | 355,087 | 358,052 | 392,910 | 402,170 |
| 1997 | - | - | - | - | - | - |
| Month | July | August | September | October | November | December |
|---|---|---|---|---|---|---|
| 2020 | 9,779 | 10,160 | 9,064 | |||
| 2019 | 11,640 | 11,619 | 11,073 | 10,401 | 10,442 | 8,732 |
| 2018 | 14,238 | 14,399 | 13,299 | 13,022 | 13,293 | 10,506 |
| 2017 | 16,470 | 17,1021 | 15,959 | 13,801 | 15,444 | 12,303 |
| 2016 | 18,552 | 19,613 | 17,659 | 15,930 | 17,947 | 15,064 |
| 2015 | 22,160 | 20,488 | 20,271 | 18,085 | 18,936 | 16,233 |
| 2014 | 22,528 | 20,767 | 22,503 | 20,774 | 21,090 | 18,248 |
| 2013 | 19,833 | 18,800 | 18,645 | 19,878 | 19,697 | 16,707 |
| 2012 | 15,870 | 16,919 | 15,935 | 15,997 | 17,004 | 13,486 |
| 2011 | 14,833 | 15,168 | 14,527 | 13,229 | 14,869 | 12,004 |
| 2010 | 15,295 | 15,055 | 14,834 | 13,118 | 13,879 | 11,663 |
| 2009 | 22,863 | 21,529 | 22,882 | 20,891 | 21,561 | 18,027 |
| 2008 | 26,216 | 24,988 | 24,556 | 24,461 | 22,866 | 22,178 |
| 2007 | 34,308 | 33,792 | 29,960 | 31,779 | 29,273 | 26,544 |
| 2006 | 48,782 | 48,369 | 44,400 | 43,622 | 42,914 | 39,703 |
| 2005 | 87,309 | 86,011 | 77,018 | 75,643 | 71,573 | 68,961 |
| 2004 | 157,181 | 147,470 | 129,171 | 129,410 | 121,968 | 116,533 |
| 2003 | 299,430 | 273,494 | 251,794 | 244,906 | 222,996 | 214,305 |
| 2002 | 488,031 | 452,707 | 392,851 | 387,219 | 372,573 | 355,143 |
| 2001 | 947,114 | 946,365 | 809,020 | 777,610 | 711,196 | 680,051 |
| 2000 | 1,364,343 | 1,441,938 | 1,230,964 | 1,242,243 | 1,136,517 | 1,133,337 |
| 1999 | 955,942 | 1,058,800 | 1,013,972 | 1,083,423 | 1,074,254 | 1,123,225 |
| 1998 | 439,187 | 494,029 | 492,626 | 551,152 | 622,170 | 665,255 |
| 1997 | - | 221,981 | 232,979 | 258,874 | 256,850 | 275,278 |
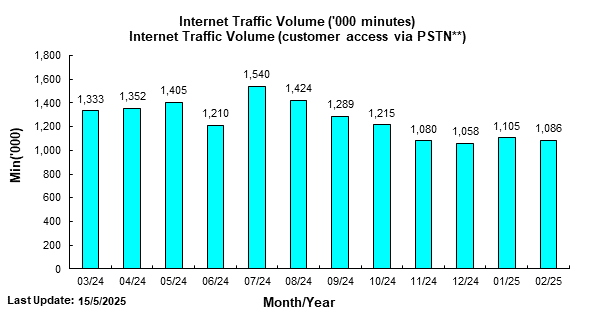
**Not including customers access via leased circuits and broadband services.
Note 1: The figure has been revised to reflect the adjustments filed by Internet Service Providers